greenhouse gas emissions inventory
Inventory scope
Celeris Systems is an office-based organization and considered a low emitter with the majority of Greenhouse Gas (GHG) emissions coming from purchased electricity.
Our GHG inventory includes data from individual facilities (primarily leased office facilities). The total number of sites changes from year to year as sites are added (because they have been acquired, newly established, or newly determined to be within the boundaries of the inventory) or removed (because they were divested, closed or newly determined to be outside the boundaries of inventory) during the course of the reporting year.
Celeris System’s worldwide GHG emissions comprise energy use and emissions data from these leased/rented office facilities.
Celeris selected eGRID subregion to the national average emission rates (lbs/MWh) for carbon dioxide (CO2), sulfur dioxide (SO2), and nitrogen oxide (NOx).
INVENTORY
Celeris uses th eGRID subregion emission rates and percent line loss, Celeris Systems estimated annual use of kWh of electricity results in pounds CO2, pounds SO2, and pounds NOx emitted in one year for each of three facilities, Anaheim, CA, Keyport, WA; and Panama City FL.
CAMX Emission Rates for Anaheim, California location Zip 92806
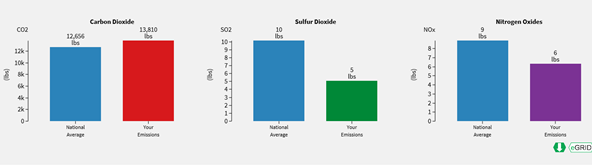
Using the eGRID subregion emission rates and percent line loss, Celeris Systems estimated annual use of kWh of electricity results in pounds CO2, pounds SO2, and pounds NOx emitted in one year from the power plants in Southern California area.
This is an estimate of the pounds of air pollutants caused by the electricity Celeris Systems uses in during one year. Celeris Systems annual emissions are estimated from the national average electricity consumption of 1.22 kWh/sq. ft./month for commercial customers and the eGRID subregion CAMX (WECC California) emission rates and include a grid region specific adjustment for line losses of 4.23% percent.

NWPP Emission Rates Keyport, Washington Zip 98345
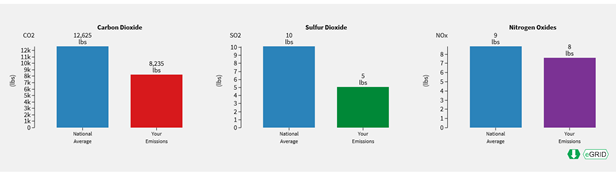
This is an estimate of the pounds of air pollutants caused by the electricity you use at Celeris Systems Keyport, Washington Facility during one year. The Company’s annual emissions are estimated from the average home consumption of 1,011 kWh/month and the eGRID subregion NWPP (WECC Northwest) emission rates and include a grid region specific adjustment for line losses of 4.23% percent. Estimate annual emissions for commercial customers here.
SRSO Emission Rates Panama City, Florida Zip 32408
The following is an estimate of the pounds of air pollutants caused by the electricity Celeris Systems uses at our Florida Location duing one year. The Company’s annual emissions are estimated from the national average electricity consumption of 1.22 kWh/sq. ft./month for commercial customers and the eGRID subregion SRSO (SERC South) emission rates and include a grid region specific adjustment for line losses of 4.49% percent.